Outperformance & Underperformance
by PRASHANT SHAH -
When you identify the stock that is outperforming the market, buying it is easier said than done. There is always this conflict with our thought process and belief system. Human nature is such that we always ask for discounts or we like to buy stuff at a cheaper price. A stock that is traded near historical lows is easier to buy because we often believe in buying something that has the potential of rising. We may however exit early because riding what is going up is a psychologically tough option for many. We feel that if we buy something at a lower level, it has a limited downside and a huge upside potential. So, it is typically easier to buy underperforming and relatively weak stocks rather than strong stocks.
On the contrary, it is difficult to buy what is going up because we are worried that we might get caught with stock right near the top. Even a marginal technical correction from the highs will result in a drawdown that will make us get into a panic mode. There are pros and cons to every method. Buying when the price is rising and at high looks intelligent in hindsight. But it is not psychologically comfortable at a practical level. But I believe chances of rewards are more when we are least comfortable in trading.
Outperformance does not necessarily follow outperformance. Price can consolidate or there can be temporary underperformance. There are patterns in the behaviour of these outperformers and underperformers of stocks to index.
Broadly speaking, listed below are the possibilities:
- Outperformance – followed by Outperformance.
- Outperformance – followed by Consolidation.
- Outperformance – followed by Underperformance.
Similarly,
- Underperformance – followed by Underperformance.
- Underperformance – followed by Consolidation.
- Underperformance – followed by Outperformance.
And
- Consolidation - followed by Outperformance.
- Consolidation - followed by Underperformance.
Any stock would go through this cycle of performance. It goes through this phase of performance in relation to the market index, sector index, and across different timeframes. Just like the price has different trends and phases on various timeframes, there are different phases of relative performance too.
Outperformance -> Consolidation -> Underperformance
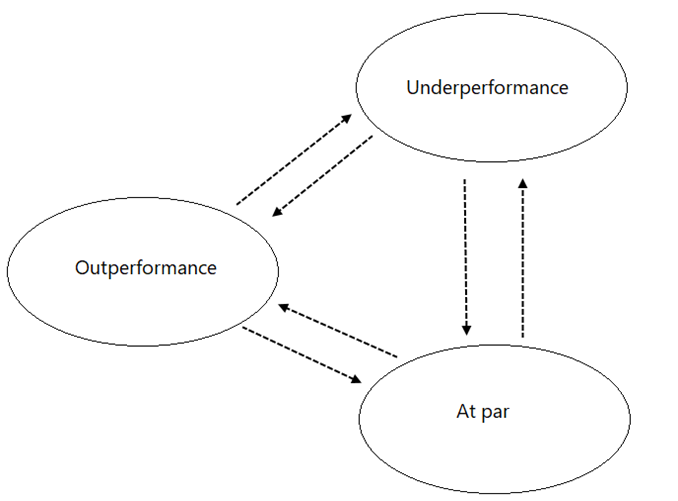
Performance cycle
Identifying outperforming or underperforming stocks is the first task. The decision to trade or invest in them depends on several other factors as well. When we identify a strong stock in the universe, it is not necessary that it would continue to outperform. We can wait for a consolidation and then look for affordable trading or investment opportunity.
Take a look at the table given below; it is what we discussed in the earlier chapter:
Table 2.1: Market trend and Stock trend.
Market trend Stock trend
Up More up
Down Up
Down Flat
Down Less Down
Flat Up
To derive patterns of the relative strength and to dig it further, let us explore this concept of outperformance and underperformance. Stocks performing better than the index is outperformance, but the nature of outperformance depends on the behaviour of the stock and the benchmark.
When the market goes up and the stock goes up more it is a strong outperformance. When the market falls, but the stock goes down a little, it is also a case of outperformance. But it is relatively weak because the market environment is bearish and even though outperforming, the stock price is falling.
So, let’s enhance the above table further and focus on the nature of outperformance and underperformance.
Table 2.2: Market trend, stock trend and outperformance.
Market Stock trend Outperformance
Up More up Strong
Down Up Strong
Down Flat Moderate
Down Less Down Weak
Flat Up Strong
Table 2.3: Market trend, stock trend and underperformance.
Market trend Stock trend Underperformance
Down More Down Strong
Up Down Strong
Up Flat Moderate
Up Less Up Weak
Flat Down Strong
So, we have segregated the Outperformance and Underperformance into three categories: Strong, Weak and Moderate.
Now, based on the performance and the trend of the market, we can decide the stocks showing strengths and weaknesses.
If you come across a group of stocks where you see multiple stocks showing a pattern of strong outperformance, how will you decide which one is better? It is logical to say that the stocks that delivered better returns are stronger. Better the performance, the stronger it is.
See table 2.4.
Table 2.4: Relative strength and net return.
Stock Return Index Return Relative Strength Net Return
A 5% 3% Bullish 2%
B 8% 3% Bullish 5%
The net return in the above table is the return of stock minus the return of the index.
Conceptually, both are relatively strong stocks because they are performing better than the market. Stock B is stronger than stock A. Because the net return that it is producing over the benchmark return is greater than stock A.
If that is the case, we can rank the stocks based on their performance. In the yearly data of stocks that we discussed in the earlier chapter; I studied the top 100 stocks and the bottom 100 stocks. This essentially means I ranked them based on their performance, right? The top stock in the list is the best performer.
So, we have discussed three things so far in this chapter:
1 – There is a performance cycle that stocks go through in different timeframes versus the broader market index, sector index etc.
2 – We can divide the Outperformance and Underperformance into three categories: Strong, Weak and Moderate.
3 – We can rank stocks based on their performance.
Strong outperforming stocks with a high rank in terms of performance are bullish stocks and strong underperforming stocks in the bottom slot in terms of performance are bearish stocks.
We will come back to this.
