Introduction
by PRASHANT SHAH -
Broadly, there are two types of market analyses: financial and technical. Financial or fundamental analysis is about understanding the business of the company, its balance sheet and other financial reports and studying the micro- and macro-economic factors. Technical analysis, on the other hand, studies the behavior of the price action and the demand-supply equation based on it.
Below are the basic tenets of technical analysis, from the classic work by Robert D. Edwards and John Magee, Technical Analysis of Stock Trends:
- The price moves in trends, and a trend will continue until reversed.
- Stock prices are determined by the interaction of demand and supply, and the shifts in them cause the reversal in trends.
- Price discounts everything. Shifts in demand and supply can be detected in charts.
- History and chart patterns tend to repeat themselves.
Line, bar and candlestick charts are very popular among technical analysts. Below image explains their construction.
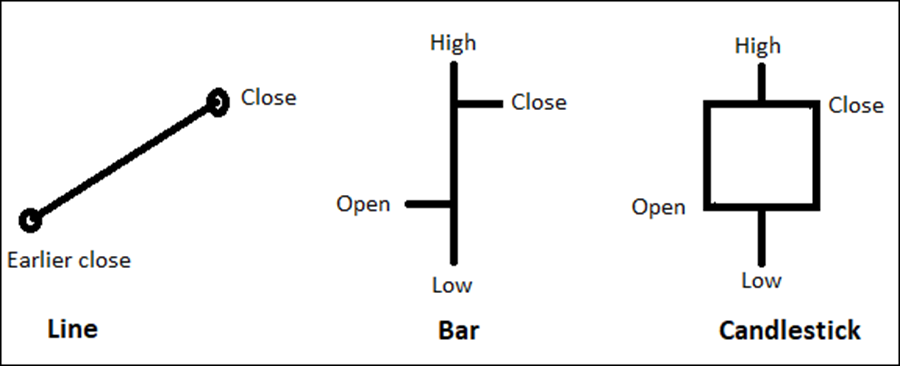
Line charts are drawn by connecting closing prices. In bar charts, a bar is bullish when its closing price is higher than the earlier period; it is bearish when closing price is lower. For candlestick charts, a candle is bullish when close of a period is higher than open, else it is bearish.
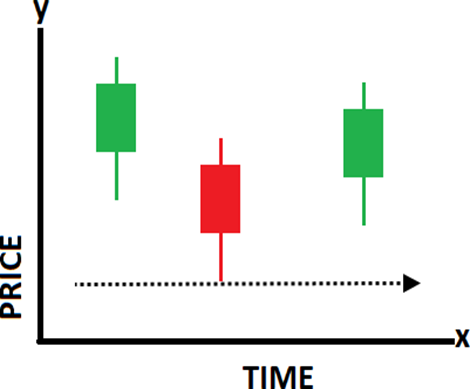
The above image shows a price and time chart. There are two dimensions to these charts: price and time. In these charts, time is plotted on the X axis and price on the Y axis. They can be a viewed on different time frames such as daily, weekly, monthly or even intraday time intervals such as 60 min, 30 min, 15 min, etc. Two-dimensional charts move with the passage of time.
Point & Figure
Point & Figure (P&F) charting has a long history and is known to be the oldest charting method. It was very popular before computers came into existence. Bar and Candlestick charts gained more popularity due to simple plotting and the availability of software platforms. We are quite used to these modern charting methods today; in fact, most techniques of technical analysis are designed using them.
But P&F has its own place and is also being actively and successfully implemented today. The recent advancement in technology has made it possible to explore the clarity and simplicity of P&F. It is a complete charting system, objective in nature and applicable on all types of financial instruments. In fact, because there is more objectivity and science that makes me call P&F charts a tool relevant for the next-generation.
P&F is one of the noiseless categories of charting techniques. Noiseless, because it filters out unnecessary data and presents a clear picture. It is also known as the timeless or one-dimensional chart because it only takes price into account while plotting. P&F formations help us in clearly defining the market structure over different time horizons. Clear formations remove the confusion while placing the trades and enable easy designing of strategies. Once understood and practiced, it would be difficult to trade or invest without the P&F charts.
Let us begin with understanding their construction, which is the most important part of P&F analysis. I want you to spend enough time understanding the basics before moving on to patterns and trading. In my talks on P&F, people usually are more interested in knowing trade setups immediately; they don't focus much on the basics and struggle later while discussing the trading strategies.
