Construction & Exercise
by PRASHANT SHAH -
Construction
As mentioned earlier, P&F charts have a long history and an interesting journey that began from the figure charts. Unlike the usual candlestick or bar charts, P&F charts are plotted vertically. They are explained stepwise below. It is said that plotting of prices began from these charts, and I am sure you will find it very interesting to learn the method.
Figure Charts
Figure charts are plotted in the tabular format. We draw a line chart by connecting the closing prices of a particular time period. Instead of that, figure charts are plotted by writing the prices in the boxes that move vertically (see below Image).

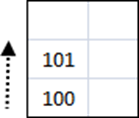
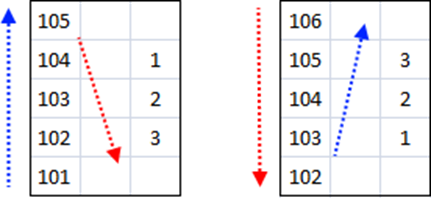
A line chart connects all the prices, even if the price has been flat or has not moved much. A figure chart moves only when the price moves by a particular predefined range; nothing gets marked if the price remains flat. That range or move must be decided by the user to plot the figure chart. For example, if a stock is trading at 100, we may decide to plot the price only when it moves by 1 rupee or 1 point. So the next figure will be written only if the price moves by 1 box or more. Any price move below 1 will be treated as insignificant and will not be plotted. Below image shows how the plotting will look if the price moves from 100 to 101.
If the price goes up further by 1 point to 102, it will be written in the next higher box. Note that it should be at or above 102 to qualify for plotting. New price will be written in the boxes as and when the price moves up by 1 point . If the price goes straight to 105, all the boxes in between will be marked. Below image shows the plotting if the price moves to 105.
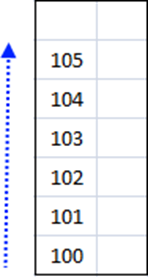
In the above example, price gets plotted only if it moves by 1 point, hence size of the box is 1.
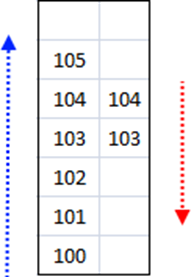
Further, if price goes to 106, it will be marked in a similar manner. Repeated plotting doesn't happen in these charts. So if price trades at the same level, the charts will not move. So here, if price remains at 105, we will not write 105 again; the chart will simply remain the same. But, what if the price turns down and goes below 104? It can't be marked in the same column, right? Hence, the column needs to be changed and 104 should be written in the subsequent column (see below Image).

Notice one thing here: ‘105’ is not written in the next column because we begin marking from 104, that is, when it started moving down. The definition of moving down is: when the price went below the previous box-price of 104. So that means the column needs to be changed when the price changes its direction. This is quite interesting, since there are columns in the figure chart that show the number of times the price has changed direction. And figures in each column will display the extent the price has traveled before changing direction again.
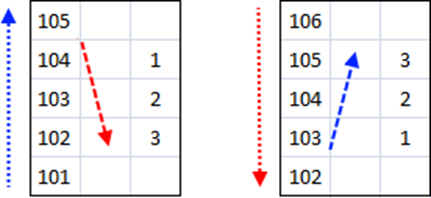
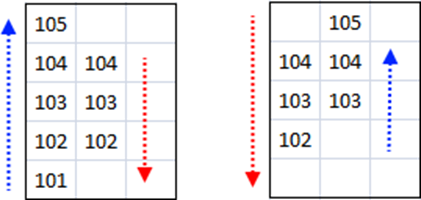
In the above example, the price is falling now. And if it goes down to 103, it will be written in the same column, as shown in below Image.
The current figure is 103, and if it goes to 102, plotting will be continued in the same column and it will not be changed as long as the price continues to move in the same direction. The column will be changed if the price goes higher. The definition of going higher is: when the price moves above the previous box-price of 104. So, if price goes to 104, then the column needs to be changed again. Image 1.1.8 shows the plotting if the price goes to 105 again from 103.

This is how figure charts are plotted. Notice that every column that moves down begins with one box lower than the last high price and the column that moves up begins with one box higher than the lowest price in the previous column.
The size of the box in the above example was 1. It can be plotted with 2 points, 5 points or any other number for that matter. So a figure chart can be plotted with various box-sizes; but, the method of plotting remains the same. It can be easily imagined that if box-size is kept high then plotting will be less and if box-size is kept low, plotting will be more. We discussed that a column is changed when price changes direction. The requirement of change of direction can also be defined. In the above example, the column was changed when price moved back to 104 from 105 or it went back to 104 from 103. So the column was changed when the price changed direction by one box, this is known as reversal value. So the figure chart shown above is a one-box reversal chart. Had this reversal value been 2 instead of 1, price had to go below 103 from 105 to change the column.
So there are two parameters when plotting the figure chart: box-value and reversal value. In the above chart, both are 1. The same chart can be plotted with a three-box reversal method also; meaning that a column will be changed only when price has changed direction by three boxes. So price will have to go at or below 102 from 105 to change the column. This is also applicable to price
changing direction from down to up. The price at 102 will have to go at or above 105 to change the column from down to up. The counting is quite simple: count three boxes below 105 to arrive at reversal price of 102 and three boxes above 102 to arrive at reversal price of 105 (see below Image).
There is another way to calculate this. Three boxes are 3 points in the above example because box- value is 1. Had there been 5, reversal points would have been 15. Hence, multiply the box-value by 3 to calculate the points that need to be deducted from the high price or added to the low price to arrive at a reversal price.
Note that this three-box requirement is not for continuation plotting; price has to reverse by three boxes to qualify for the change of column. Once the column is changed, every box will be plotted; it will need to go in the opposite direction by three boxes to change the column again. As a result, reversal will not be plotted frequently as small price fluctuations will be ignored while plotting the chart.
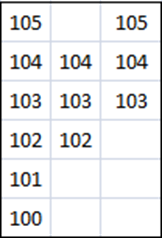
In the same example, if the price goes below 102 from 105, then the column needs to be changed and all the numbers to arrive at 102 are written in that column. In the same way, if price goes above 105 from 102, all the three figures to arrive at 105 are written (see below image).
So a three-box reversal chart will have a minimum three filled boxes in any column. Below Image shows the three-box reversal figure chart with price moving to 102 and then 105.
Though these charts are not plotted when price doesn't move, continuation price and reversal price is known at every point in time. If price goes above 106 in the above chart, it will be written in the same column. If it moves down to or below 102, the column will be changed again. If it remains between 106 and 102, nothing will get plotted. So, if price is trading at 104, figure will remain same, hence actual price can be different from the current figure chart box-price. Note that continuation or reversal prices were calculated from last figure price and not from actual price.
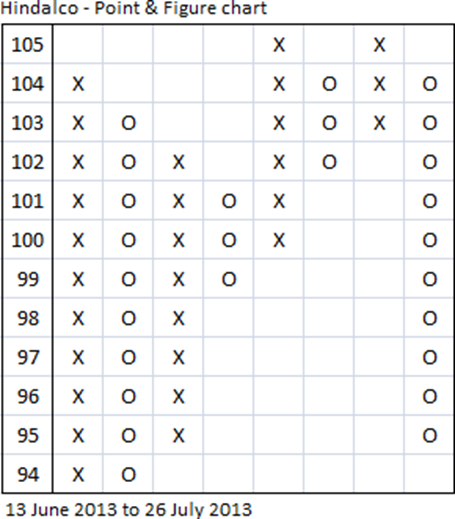
Below is a figure chart of Hindalco plotted using daily closing prices between 13th of June, 2013 to 26th of July, 2013.

The box-value in the above chart is 1 and the reversal value is 3, which can be changed as per requirement. Simple observation of the above chart will help you to know the levels where price has traded most and where it has seen more demand or supply.
Point Charts
It is not always practically feasible to write figures in the boxes. Imagine the pain especially when it is a four or five digit price and during the time when there were no computers. The clever thing is to
make an index of figures at the left-hand side and just point (mark) the chart instead of writing the figures whenever the requirement of filling the box is met. Charts plotted with this method were called point charts. Below Image is the same Hindalco chart plotted as a point chart.

It looks better than the figure chart and is easy to maintain as well. But a major issue remains with both figure charts as well as point charts: We don't know whether a column is representing rising or falling prices; visually it is difficult to differentiate between them.
Point & Figure Chart
The solution was found by using different markings for both types of columns: Rising prices were marked with a cross-mark and falling prices were marked with a circle. Eventually, cross-marks became 'X' and circle became 'O'. Below Image shows the same chart of Hindalco plotted with 'X' and 'O' columns, representing up and down moving prices respectively.
The chart seems clean and complete. Charts plotted in this manner are known as Point & Figure charts. We plotted the above chart with 1 box-value and 3 reversal value, hence it is known as '1 x 3 Point and Figure chart'. Had the same chart been plotted using 10 as box-value, it would be named '10 x 3 Point and Figure chart'.
Three-box reversal charts are popular and widely used because reversal is weighed more, and that effectively reduces the noise. The box-price is the price of the 'X' or 'O' box. Remember, we calculate box-value and reversal value from the last box-price and not the actual price. So, for a P&F analyst, it is box-price that matters and continuation or reversal levels should always be calculated from box- price . The major feature of P&F charts is that 'X' represents rising price and 'O' represents falling price. Time or volume is not considered while plotting them. Only price is plotted – nothing else; which is exactly why they are also known as one-dimensional charts.
Exercise
As said earlier, the basics and construction of P&F charts should be very clear before one begins analyzing them. If you don't spend enough time on construction, confusion might arise while discussing patterns. Here is an exercise you have to complete, however boring it may seem.
Below is a table for construction exercise of a 10 x 3 P&F chart.
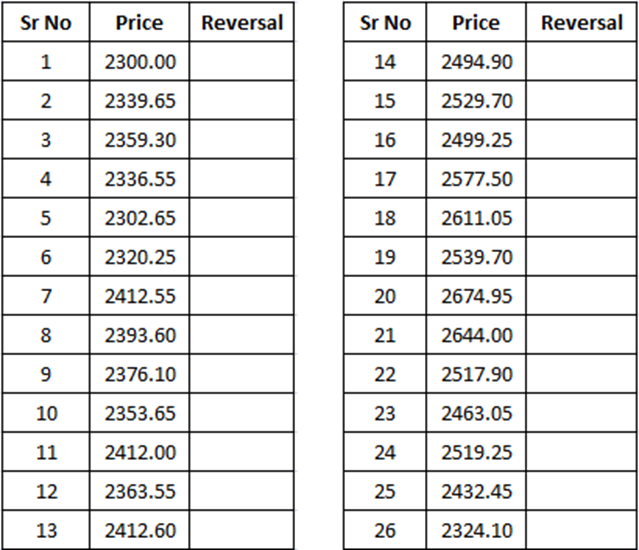
The table depicts the actual prices of a stock. You may wish to plot the chart on your own and then compare it with the final plotting. Put reversal price against every price in the above table after plotting the chart in Excel sheet, as shown below. Reversal price is a level that will fulfill the criteria to change the column.
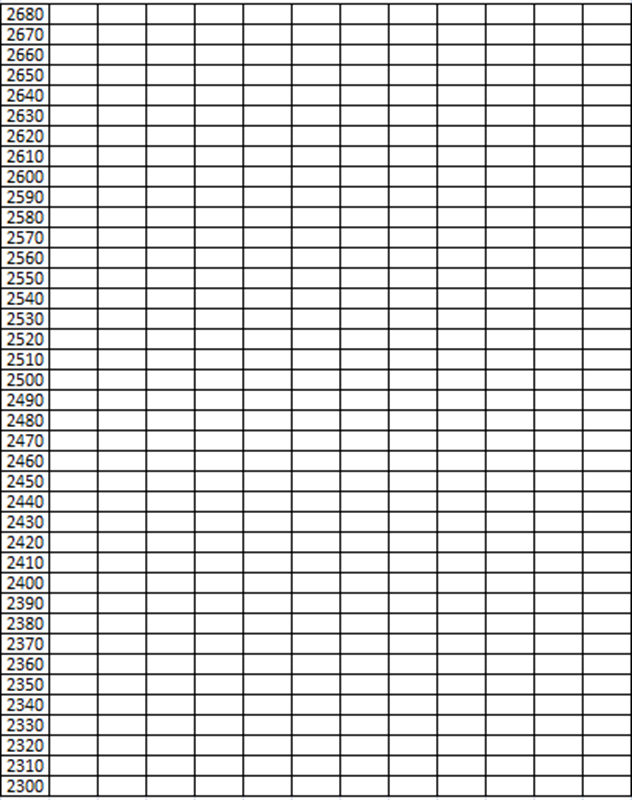
A better option is to plot simultaneously and follow stepwise explanation. You can complete the exercise on your own after the 6th price and compare with the final chart. We are plotting a 10 x 3 chart, so continuation price will get plotted at every 10-point move in price. A reversal price is 30points away from the last box-price. If the price is in a column of X, then reversal price will be 30- points below the high price in column of X and vice versa.
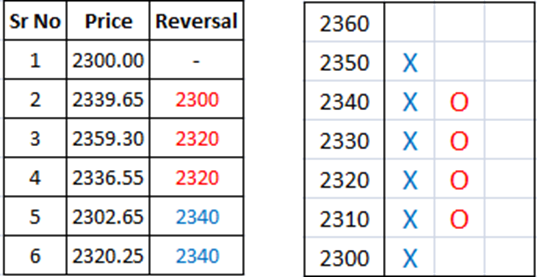
- The first price is 2300. Nothing can be done at this price, because we don't know whether price will move higher or lower and it will require starting the plotting with 'X' or 'O'. Plotting will begin with column of 'X' if price goes 10 points higher to 2310, and it shall begin with column of 'O' if it goes 10 points lower to 2290.
- Price is moving higher and reaches 2339.65. So, plotting will begin with column of 'X' which will get marked up to box-price 2330. Box-price of 2340 is not marked because it has not been reached. The current box-price is 2330; hence, reversal price is 2300, which is 30 points less or three boxes away from box-price of 2330.
- The next price is 2359.30. Price is moving higher, so we continue to fill boxes in the same column of 'X' up to the box-price of 2350. Reversal price would be 2320, so the column will turn to 'O' if price
falls below 2320. Continuation box-price is 2360; meaning that even if price goes up by 70 paise from the current price, a new box will be plotted.
- The price is 2336.55. It has not gone above 2360 to mark 'X', nor is it below the reversal value of 2320 to flip over to column of 'O'; hence, nothing can be plotted. Chart will not move, so reversal level would remain unchanged.
- The price is 2302.65. It has gone below reversal value 2320, so column needs to be changed from 'X' to 'O'. Box-price of 2300 would not get filled because price has not gone below it. So, marking of 'O' would stop at box-price 2310 and reversal price would be 2340, which is 30 points added to the current box-price of 2310.
- There will be no marking at 2320.25. It has not gone below 2300 to plot continuation box, nor gone above 2340 to plot reversal.
Belo Image shows the status of plotting so far.
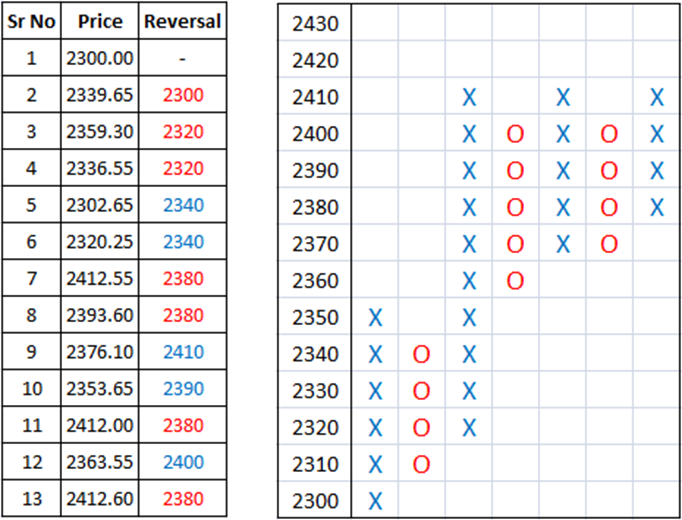
- Price goes up to 2412.55. As the price has moved well above the reversal price of 2340, flip over to a column of X and plot X upto the box-price of 2410. The reversal price now is 2380, 30-points below the last price of 2410.
- It is status quo. Price is at 2393.60, which doesn't qualify for plotting either way.
- Price goes down to 2376.10. It has fulfilled reversal criteria of going below 2380; hence, column needs to be changed to 'O' up to box-price 2380. Reversal price is 2410.
- Price continues to go down up to 2353.65. Box-price of 2360 gets filled, but 2350 will not be marked because price has not gone below it. Reversal price is 2390 where column will be changed to 'X'.
- Price is 2412 again, which has qualified for the reversal. So, column will turn to 'X', which will be plotted up to box-price 2410. Reversal price would be 2380.
- Price goes down to 2363.55 to mark the reversal. So column will be changed to 'O', which will get filled up to box-price 2370. Reversal price is 2400.
- Price has come to 2412.60 again. Column will turn to 'X' again up to box-price 2410. This is the third occurrence of this box-price getting tested. Reversal price would be 2380.
Below Image shows the plotting so far.
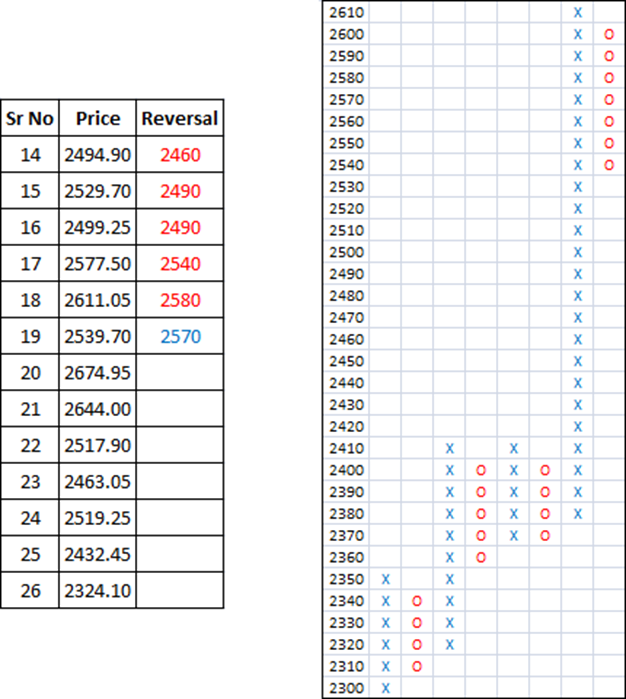
- The resistance at 2410 gets broken finally. Price went up to 2494.90, which qualifies for plotting continuation boxes up to 2490. Reversal price is 2460.
- Price is 2529.70. Plotting will continue in the same column of 'X' up to 2520. Box-price of 2530 does not qualify for plotting. Reversal price is 2490.
- Price is 2499.25. Nothing gets plotted.
- Price is 2577.50. So, it has continued to move up further, which qualifies for continuation plotting of 'X' in the same column up to box-price 2570. Reversal price is 2540.
- Price continues to move up to 2611.05. Column of 'X' will get plotted up to box-price 2610. Reversal price is 2580.
- Price is 2539.70. It has gone much below reversal price requirement of 2580. Column will be changed to 'O', which will get filled up to box-price 2540. Had the price been at 2541, box-price of 2540 would not have been marked. Reversal price is 2570.
Below image shows the plotting so far.
- The next price is 2674.95, which qualifies for the reversal. Bulls have got the control back to change the column to 'X' and fill the boxes up to box-price 2670. Reversal price is 2640.
- Price is 2644. Nothing gets plotted.
- Price tumbles to 2517.90, which qualifies for reversal to column of 'O' up to box-price 2520. Reversal price is 2550.
- Price goes down further to 2463.05. Box-price of 2470 gets filled in the same column of 'O'. Reversal price is 2500.
- Price goes up to 2519.25, which qualifies for column reversal to 'X' up to box-price 2510. Reversal price is 2480.
- Price falls to 2432.45, which qualifies for reversal to column of 'O' that will get plotted up to box- price 2440. Reversal price is 2470.
- Price is 2324.10. So, box-price of 2330 gets marked in the same column of 'O'. Reversal price is 2360.
Below Image shows the final plotting of the chart.

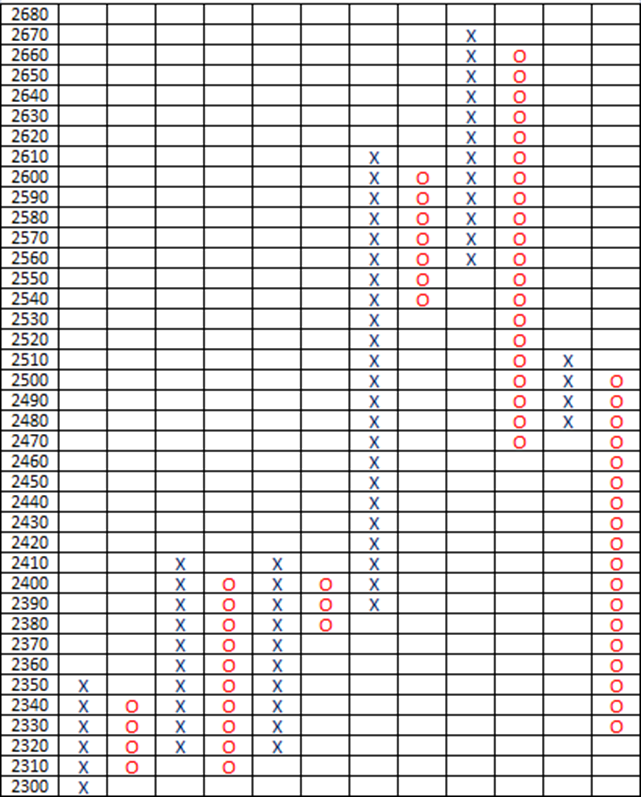
The prices in the exercise table (Image 1.1.20) are actual daily prices of Bajaj Auto between September 2014 and January 2015. Only relevant prices were taken into account to explain the plotting, and even among these, notice that plotting didn't happen at every price.
