Understanding P&F
by PRASHANT SHAH -
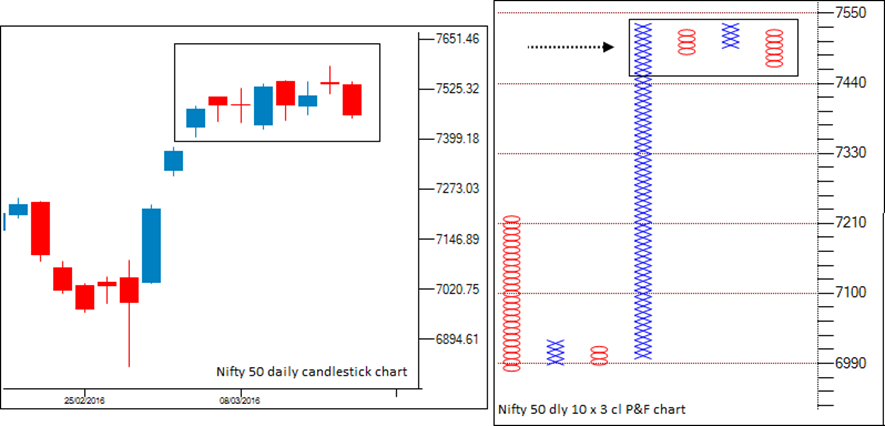
P&F charts are plotted vertically and move up and down in columns of X and O respectively. So, what we can see in large horizontal price–time charts will be captured in several columns in P&F charts. An up move seen over several candles in the candlestick chart can be captured in a single column in the P&F chart. A single column of X or O in the P&F chart can represent price action of anywhere between 1-day to several days, as long as the reversal criteria is not met. Below Image shows two columns of 'X' and 'O' that are picked from the Nifty 10 x 3 chart plotted with daily closing prices.
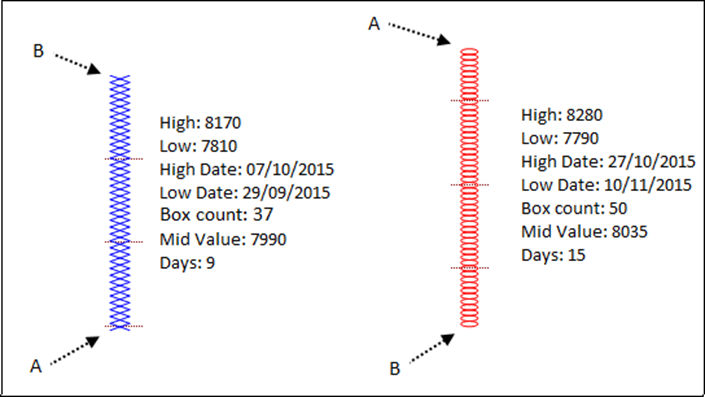
Point A is a beginning date in both the columns and Point B is the end date. Column of 'X' represents rising price, so low date is where the column begins and column of 'O' represents falling prices and hence high date is where column started, both marked by point A.
Column of 'X' that started on low date 29th September 2015, ended at high date 7th October 2015 at point B, capturing 9 days of up move. It went from 7810 at point A to 8170 at point B, which is the low and high price of the column, respectively. The total number of boxes in the column is 37, which shows a 370-point move in the same direction without a reversal of 30 points. Please re-read the construction part if there is difficulty in understanding this.
Column of 'O' started on high date 27th October 2015 marked by point A and ended on low date 10th November 2015 marked by point B. Therefore, column represents price move of 15 days. High price of the columns is 8280 at point A and low price is 7790 at point B. Number of boxes are 50 in the column, which shows a 500-point fall without a reversal of 30 points. The mid-value of each column is also mentioned, the purpose behind the same will be explained in a later chapter. Every P&F column provides all these information about the price trend in the column.
The method of construction is the unique feature of P&F charts that removes noise from the data. The chart captures price action that is significant, which is defined via the box-size and reversal value. At every plotting of 'X' that marks new high price, reversal level is being trailed up and with every new 'O' that takes the price down, reversal level is trailed down. Objectivity is the most wonderful part of P&F charts and I believe it is an integral part of trading. Everything in P&F is objective and all techniques that are going to be discussed in this book are objective in nature. With its unmatchable features, P&F complements all other methods of trading and subjective analysis.
Market Phases
There are mainly four types of market phases: Uptrend, Downtrend, Sideways and Broadening Phase, as shown in Image below. All market trends can be divided into these phases. Each of these has different characteristics, and a strategy that works in one phase may not work in another.
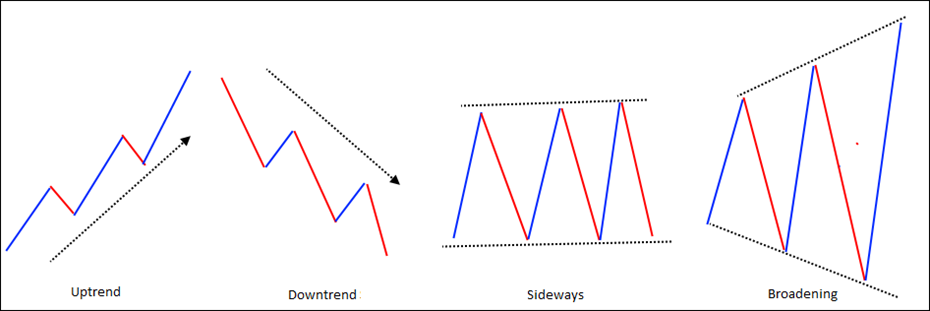
Every instrument will see these phases on all time frames – they are inevitable. By accepting this, we understand that any single strategy will not work in all the phases. Buying at low is a nice idea in an Uptrend but may not be a sensible idea in a downtrend. Selling on rise or negative breakout would be effective in Downtrend. Trading supports-resistances will work during Sideways and avoiding breakout, rather going contra, should be the strategy during the Broadening Phase. Knowing this is fine but implementation is not that simple because phase identification is a difficult task. To make it more complex, volatility can be different, and each time frame can have different phases. P&F is not immune to all these, but it has the major advantage of noiselessness. To a larger extent, the sideways phase is handled during plotting itself; charts hardly move during such phases.
Sideways markets are difficult to handle. Apart from boredom and frustration, a major issue a trader faces during this period is overtrading. Markets keep generating clues but do not produce strong moves; breakouts fail, and frequent trading eats out the gains made during the trending period. Trading success will be far improved only if these periods are ignored. The P&F chart is truly an effective technique here. As the P&F chart filters noise, irrelevant price moves are eliminated. Hence, overtrading too is curtailed to a big extent while using them.
The basic concepts of box-value, reversal value and type of charts are essential to be understood to plot a P&F chart. For revision, the terminologies are explained in brief again as follows:
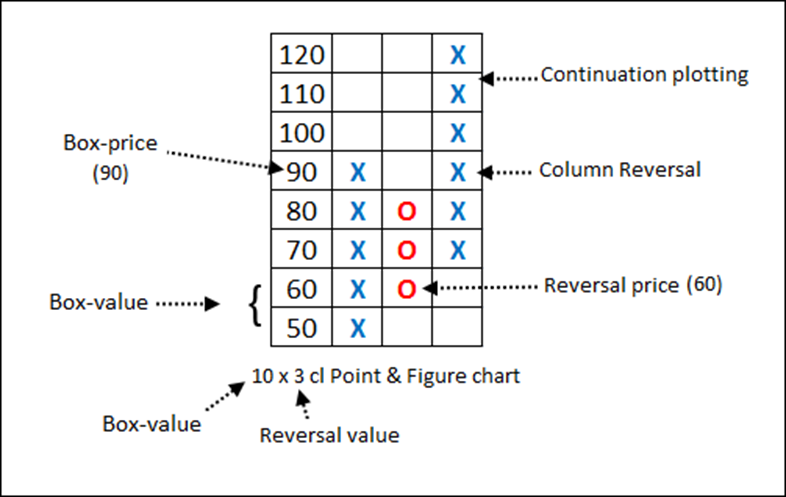
- Box-size / Box-value: Size of each box defined by the user.
- Box-price: Price of a box of 'X' or 'O'.
- Reversal value: Column reversal criteria. Normally it ranges between 1 and 5.
- Reversal price: Price arrived by calculating reversal value from last box-price. A price level, if recorded, will result in change of the column.
- Close-only: Charts plotted with closing price method are called closing only P&F charts.
- High–Low: Charts plotted with High–Low price method are called High–Low P&F charts.
- Absolute charts: Charts plotted with absolute box-value numbers.
- Log charts: Charts plotted on log scale with percentage or log box-values.
- Continuation plotting: Box plotted in the same column because price has continued the trend is known as continuation plotting.
- Column reversal: Column switch from 'X' to 'O' or 'O' to 'X' because price reversal criteria are met.
Summary
- P&F chart moves only when price moves.
- Column of 'X' represents rising prices and column of 'O' falling prices.
- Continuation and reversal prices are known to a trader at all points in time.
- P&F charts compress the data. The long and horizontal price formations in time-based charts are captured in several columns in P&F charts.
- It is not that P&F charts don't plot trendless phases. They display price congestions and not the time.
- P&F charts can be plotted using any price – daily, weekly, monthly, yearly or any other intraday time interval. The patterns and their interpretation is the same, irrespective of time frame chosen. I prefer daily over other charts and one minute over other time interval charts.
- Plot 3% box-value charts for investing, 1% for medium-term trading and 0.25% for short- term trading in stocks. Plot 1%, 0.25% and 0.10%, respectively, for indices.
