Box-value, Timeframe & Chart settings
by PRASHANT SHAH -
It must be now clear that the P&F chart moves only when price moves. There were instances where we did not plot anything. At any point in time, the continuation and reversal price level will be known. Nothing gets plotted until price either trades at or above the continuation or reversal level.
Box-value
Below chart shows the 10 x 3 chart of Bajaj Auto that we constructed in the exercise using Excel sheet.

We plotted the above chart using 10 boxes. It can be plotted using any other box-value in a similar manner. The look of the chart will be different when box-value is changed.
Below are the charts that shows the same period P&F charts plotted using 5 and 20 box-values, respectively.

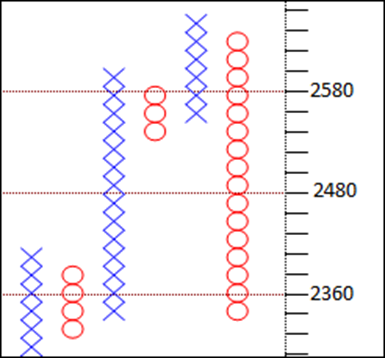
Notice that the chart plotted with box-value 5 has more columns than the chart with box-value 20. The number of columns can be increased or decreased further by changing the box-value. I am sure most of you will be thinking about which box-value is appropriate and how does one determine it. We will discuss this at length. By now, it must be clear that changing the box-value alters the amount of information captured in the chart.
Log Charts
Charts plotted with 5, 10, 20, etc., are known as absolute box-value charts, since 5, 10, etc. are absolute numbers. The major problem in plotting a chart with them is that they become less relevant when price range changes. For example, Suzlon was trading at 200 at a particular time and it traded at 20 as well. Box-value of 2 when it was trading at 200 was 1% of the price, but the same box-value cannot be used when it is trading at 20 – as it would constitute 10% of the price, and it would require a 30% move to plot the reversal. There are many such examples of stocks moving in wide ranges where the same box-value cannot be used at all price levels.
P&F charts can also be plotted on a log scale where box-value will be defined as a percentage. A chart plotted with 1% box-value will need a 1% move from the last box-price to plot the continuation box and a column reversal needs a 3% price move. The manner of construction remains the same but log box-value is used instead of absolute. This makes the chart consistent in terms of box-value, and price patterns become more relevant.
Log charts should be used when analyzing a medium-term or long-term picture. Below chart depicts the 1% x 3 P&F chart of Nifty.

Continuation box requires 1% move in the chart shown above, and price needs to be reversed by 3% to qualify for change of column.
Unlike the regular candle or bar chart, the P&F chart does not move with time. Hence, the X axis in the chart does not capture time.
Numbers or alphabets are written instead of 'X' and 'O' in the column when month is changed: 1 instead of 'X' or 'O' is plotted in the column when month turns to January, 2 when it is February and so on. A, B and C are written for October, November and December, respectively. But I prefer plotting clear P&F charts with 'X' and 'O', and all charts in the book are shown in the same manner – the period of chart is written on it.
Reversal Value
We plotted a chart with reversal values 1 and 3. Reversal value can be any other number, but the logic of construction remains the same. Reversal values between 1 and 5 are normally used. A five- box reversal chart plotted with 10-point box-value needs 50 points for a column reversal and a two- box chart will need 20 points for a column reversal. Three-box reversal chart is the most popular P&F technique and widely followed. We would focus on three-box reversal charts for a while. We will discuss other reversal values as well.
Chart Type
You may have noticed 'cl' used in the name of the charts shown earlier. It shows that chart is plotted with closing prices. P&F charts can be plotted using only one price. All charts shown above are plotted using closing prices. They can also be plotted using high or low price of the period but only one price needs to be selected for plotting.
In High–Low method of plotting, if previous column is of 'X', high price is considered for plotting and low is ignored. If high price does not qualify for the plotting of continuation box, then low price is taken into account to check if it qualifies for the reversal and column is changed to 'O' if it does. Similarly, low price is taken into account and high price is ignored if previous column is 'O'. If low price doesn't qualify for plotting, then high price is considered to check whether it qualifies for reversal.
We will discuss the method and usefulness of High–Low charts separately. 'HL' is used in the chart name when chart is plotted using High–Low price. People also use the term HiLo. Importantly, a chart name should clearly mention box-value, reversal value and data-type (High–Low or close) used for the plotting. There are other methods of plotting the prices as well, we will discuss more about them.
Time Frame
P&F charts can be plotted on all time frames. They can be plotted using daily, weekly, monthly, etc., prices or intraday prices such as hourly, half-hourly, ten minutes and even one minute. It can be plotted using tick-by-tick prices also, which is actually the origin of P&F charts. These were plotted on a piece of paper when rates used to appear on ticker tape during earlier times. But prices plotted on one-minute time interval display clearer patterns than tick-by-tick data.
Time frame is basically a data frequency to plot the charts. I recommend increasing the box-value on daily charts to look at the larger picture instead of plotting weekly or monthly charts. A weekly chart is locked at the end of the week, but plotting higher box-value daily chart gets locked every day. Box- value is the most significant variable for a P&F analyst and a most useful tool to analyse patterns.
Which box-value should be used is discussed at length in Chapter 5. But to begin with, the following are some suggestions for stocks on daily time frame:
0.25% x 3 for short-term analysis
1% x 3 for medium-term analysis
3% x 3 for long-term analysis
It is similar to daily, weekly and monthly time frames. Volatility is different for index. As the stock market index are not as volatile as individual stocks, it would be inappropriate to use the same box- size settings for index. Hence, the following box-values may be considered for indices:
0.10% x 3 for short-term analysis
0.25% x 3 for medium-term analysis
1% x 3 for long-term analysis
You can play around with different box-sizes to find the most suitable based on the volatility of the instrument and your trading time frame. Though, chapter on box-value post discussion over patterns will give you more understanding about using them.
